With automation now enabled, it's time to start reviewing the quick wins and actions from the to do list in Squared.io.
Most of the penalties in Squared.io are spend weighted, so issues on a high spending campaign are going to have a larger penalty than issues on a lower spending campaign. This helps you prioritise your time, ensuring you are taking the actions which are going to have the biggest on your account.
Review and action the to do list
When you go into an account you’ll see the account dashboard with your score, recent performance and to do list. You can also find the to do list under the ‘Optimize’ menu.
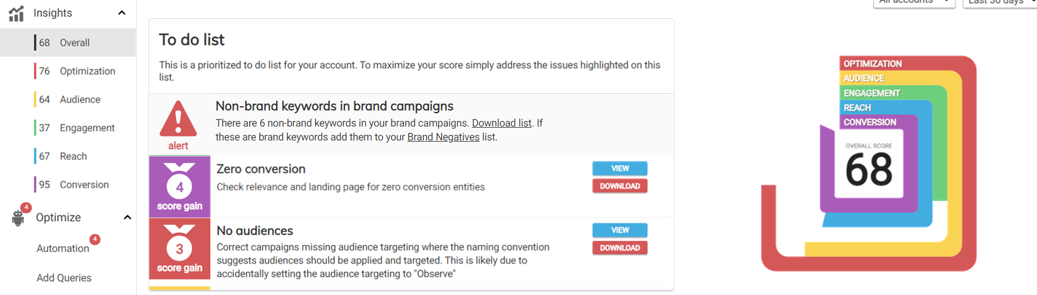
Under the to do list, you'll see the biggest penalties currently affecting your account, and the score gain you could make by fixing the issue. Clicking view on the penalty will take you to the relevant page, where you can download the penalty report. Select download to download the penalty report to Excel. All reports are in Excel format and are Google Ads Editor friendly - so you can make the relevant changes and upload them straight into your accounts. Or hit fix to resolve the issue with automation.
While some penalties may be quick fixes, like resolving negative keyword conflicts, others may take a little longer. For penalties which may need more time, it's a good idea to download the penalty report as they are sorted by spend – so you can then tackle the highest spending ad groups first and work your way down the list.
We’ll dive into the individual platform areas: Optimization, Audience, Engagement, Reach and Conversion…
Optimization score
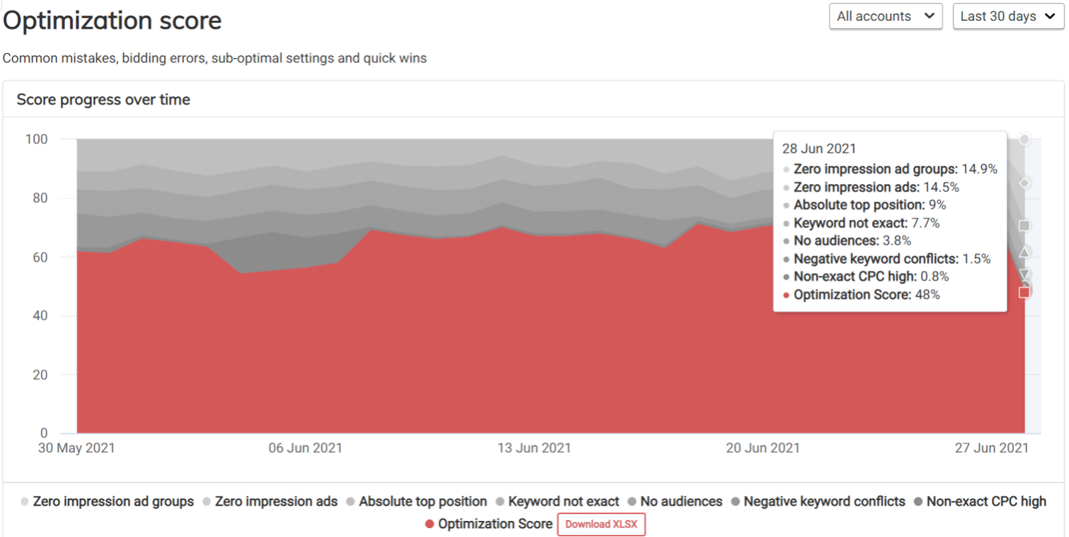
Optimization score checks the hygiene of your account and flags potential errors and quick wins. This includes optimizations like:
- Negative keyword conflicts: These are your exact match keywords being blocked by negative keywords. Download the report to see where the negatives applied (e.g., ad group or shared library)
- Missing brand safety content exclusions: Check if key brand safety exclusions are missing on your Performance Activity (e.g. tragedy content, unrated videos, live streaming videos). More information on brand safety settings here
- No audiences: See ad groups missing audience targeting where the naming convention suggests audiences should be targeted. To resolve the issue, the relevant audiences should be added to the ad group and set to ‘Targeting’ rather than ‘Observation’. More information on targeting settings here
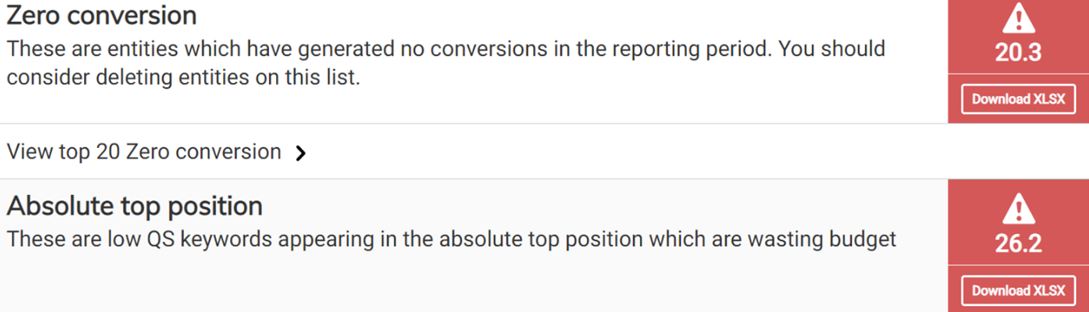
- Absolute top: Low quality score keywords appearing in the absolute top positions could mean you’re over-paying for clicks compared to your competitors. Download the report to see affected keywords and use the QS breakdown to see which areas need work
- No shared libraries: Shows you campaigns with no negative keyword shared library lists applied. Most accounts will have a set of terms they should never appear for. You can use Client, Group or Agency Negatives (under Manage) to ensure negative keywords are always applied to all campaigns moving forward
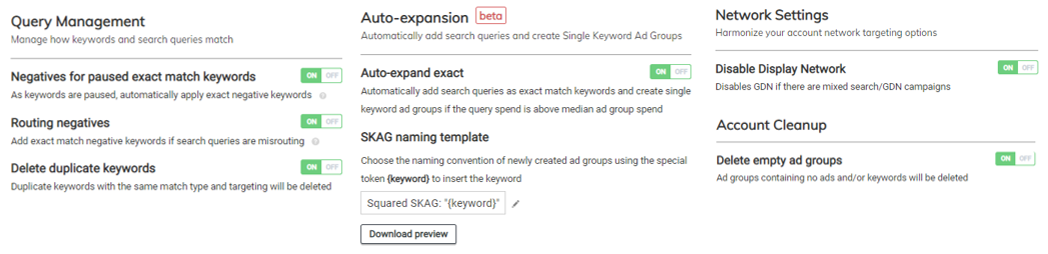
Other optimizations can simply be resolved by turning on the relevant automation options for best practice campaign settings or account clean-up options. You can find out more about the automation options here.
Audience score
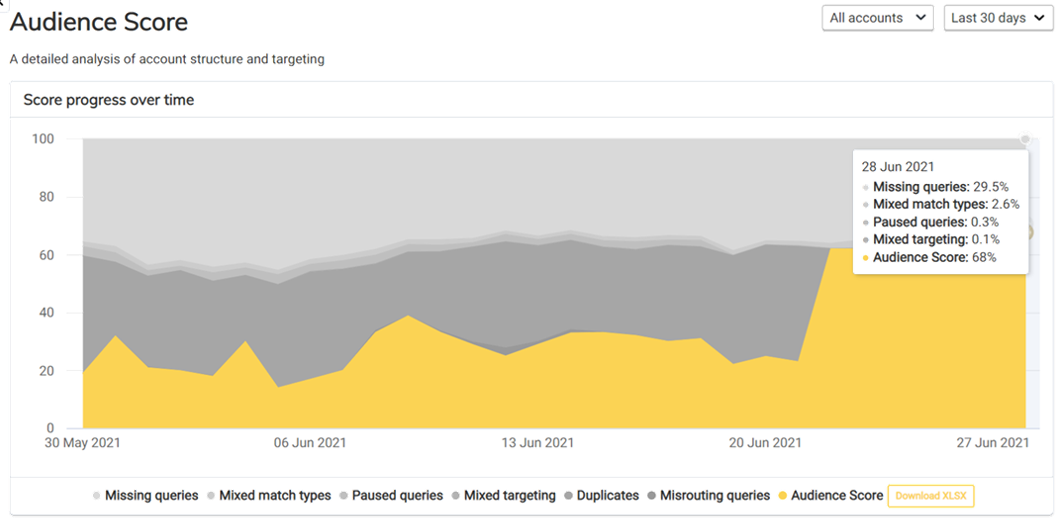
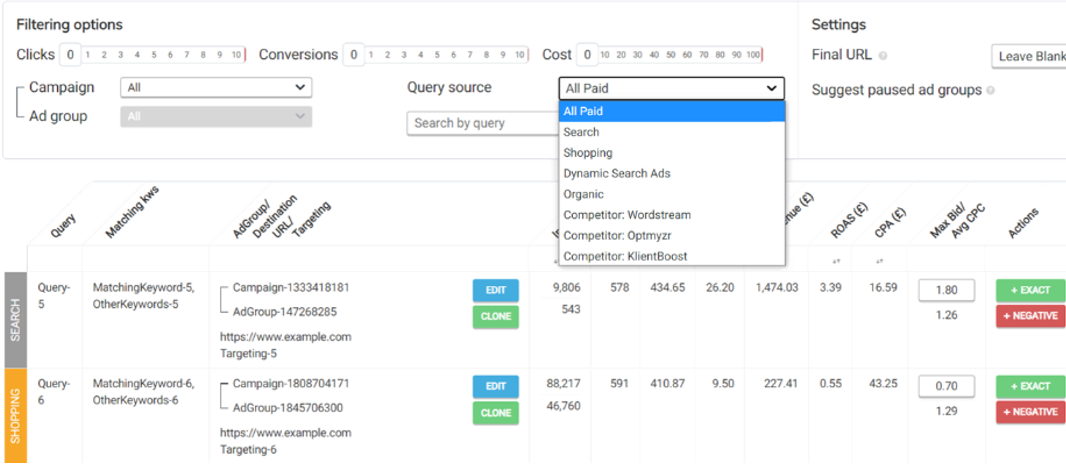
Audience score looks at how your queries are matching to keywords and other campaign types as well as the structure of your account. Many of the optimizations in this score can be made via automation:
Or via the Add Queries Tool:
If you’ve linked Merchant Centre, you’ll also see a missing or top-level categorization optimization when products in your feed are missing a granular product category. The product category column is one of the key values used by Google to determine which queries to show your products for – so this should be as granular as possible to match to the most relevant queries and expand reach.
Engagement Score
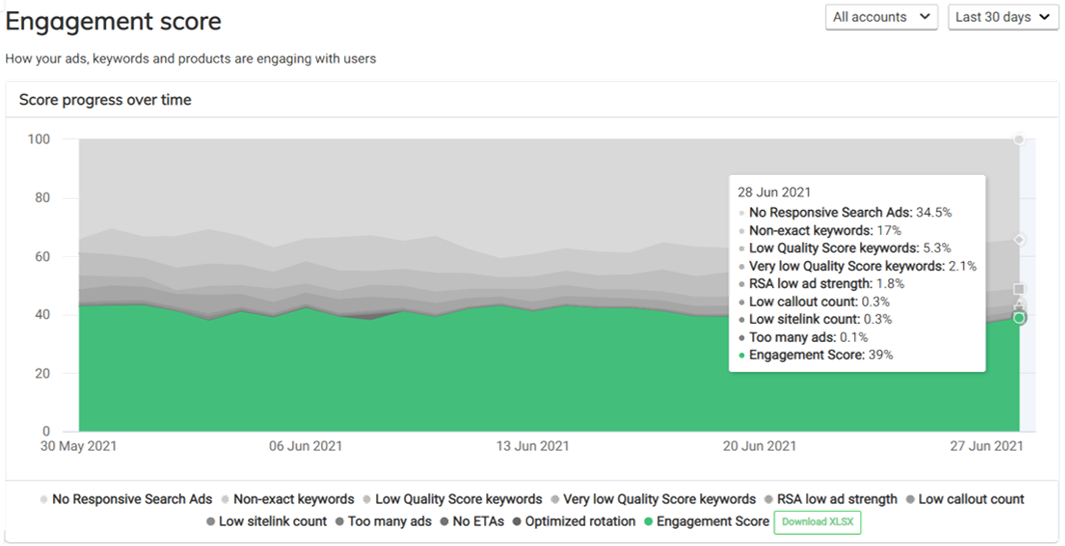
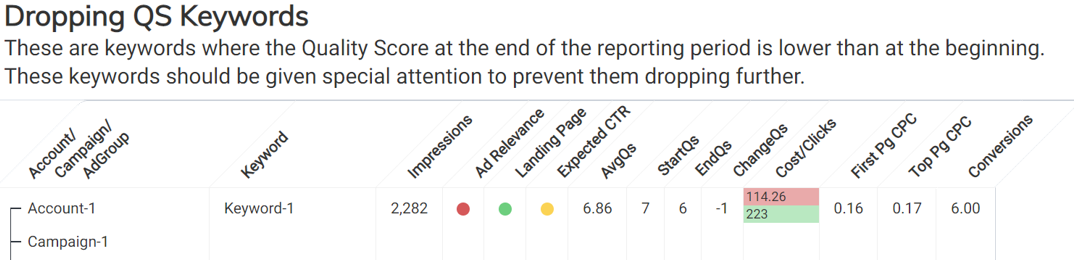
Engagement score highlights where Quality Score, ads and extensions could be improved. The Quality Score (low and very low) optimizations use a traffic light system to show you which aspects of QS could be improved (in Excel this translates to 1=below average, 2=average, 3=above average). We also have a rising and dropping QS report to show you how QS is changing over time on your keywords which can be useful for monitoring the impact of changes.
Ads and extensions checks include:
- No RSAs: which ad groups are missing RSAs. The download is spend sorted and we suggest starting at the top and working your way down to impact the most amount of spend as you make changes
- RSA low ad strength: see which RSAs have poor or average ad strength. Use Google recommendations and our ChatGPT suggestion feature to make improvements
- Too few / too many ads: Flags when there are more or fewer live ads than you would like in your ad groups. Set your ad limit in Profiles. Set up ad negatives to check when old ads and extensions are still live
- Low callout / sitelink count: See which ad groups are missing the recommended number of extensions
If you’ve linked Merchant Centre, you’ll also see a zero click product optimization when products in your feed are not delivering clicks. This could indicate the products need feed optimization to improve their delivery.
Reach score
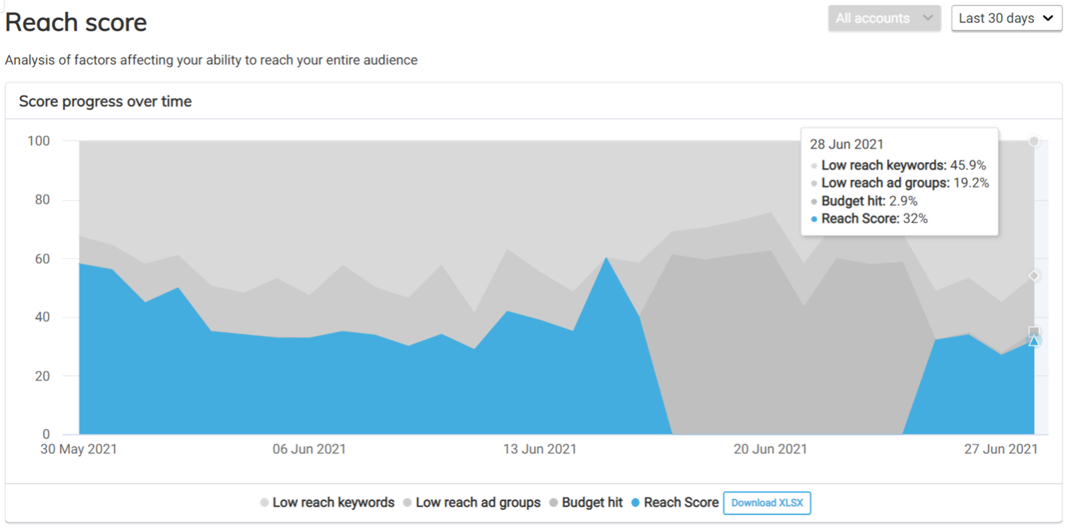
Reach score highlights the keywords, shopping ad groups and DSA ad groups missing out on impressions due to ad rank (low reach keywords and low reach ad groups) or budget constraints (budget hit).
While budget caps are good safeguard to prevent under-spending, if you’re campaigns are running out of budget each day it could mean you’re missing out on valuable traffic. For budget hit campaigns, the recommendation isn’t necessarily to increase your budget caps but look at other ways to manage spend levels.
The simplest is to review your bids/bidding strategy on the affected campaigns – lowering your bids or making your bid strategy stricter for example could result in your ads appearing lower down the page but has the benefit of keeping them live for the entire day and at a lower CPC.
You can also use Squared.io optimizations throughout the platform to make changes to under-performing keywords in budget hit campaigns. For example, lowering bids or improving QS on low QS keywords appearing in the absolute top position (absolute top in Optimization score) or lower bids/pausing zero conversion keywords (zero conversion in Conversion score).
Alternatively, you could like ad scheduling (excluding the poorest performing times of day) or bid adjustments (excluding the weakest audiences, devices, locations etc.).
If you’ve linked Merchant Centre, you’ll also see product disapproved, product demoted and product error optimizations. These reports all come with diagnostics to see which issues are impacting your delivery and how they can be resolved in the feed.
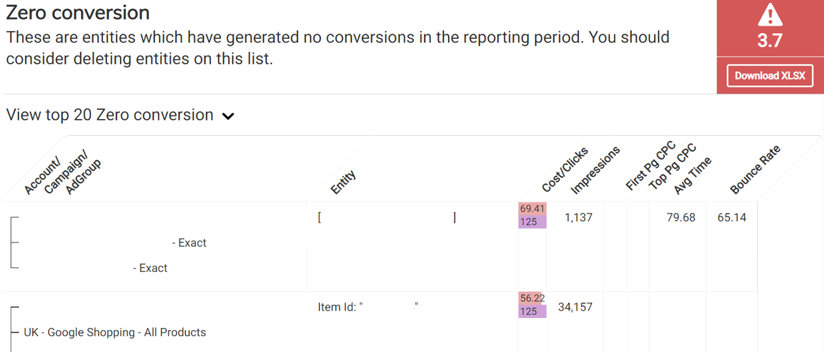
Conversion score
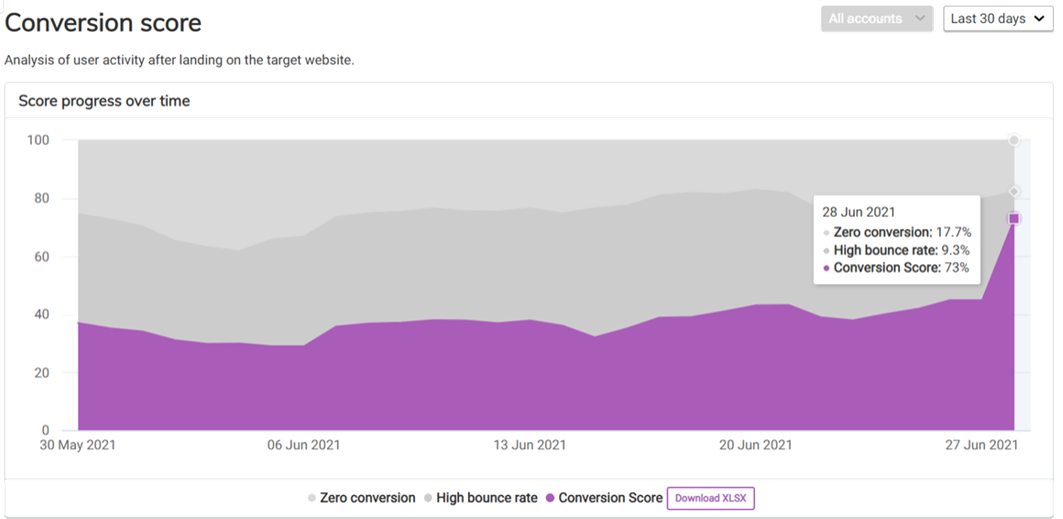
Conversion score helps reduce wasted spend across your account. The zero-conversion optimization shows you the highest spending keywords, products or DSA groups which have not recently delivered a conversion (based on the date range you select in the top right).
Entities leading to a high bounce rate will be flagged in the high bounce rate optimization. You can adjust your bounce rate target in Profiles.
We also show you the highest CPA entities to surface the least efficient parts of your account.
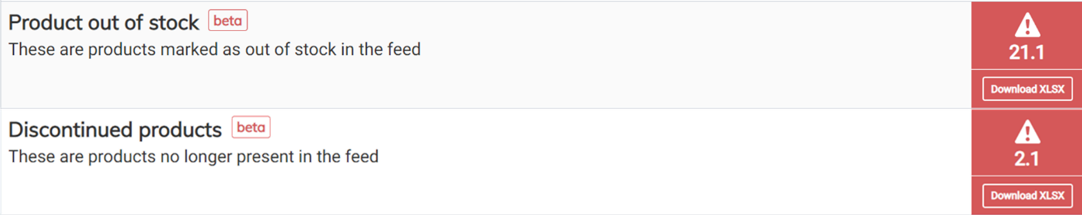
If you’ve linked Merchant Centre, you’ll also see discontinued and out of stock products. These reports have recent performance data to help you see how your shopping campaigns are being impacted by changing stock levels or products being removed from the feed.